Candlestick patterns have been a staple in technical analysis since the 18th century, with origins tracing back to Japanese rice traders. Their popularity stems from the patterns’ ability to reveal market sentiment and predict potential price movements with a high degree of reliability.
Among the various candlestick formations, double candlestick patterns are particularly valued for their clarity and significance in short-to-medium-term trading decisions.
This article will explore the most common double candlestick patterns, how they work, and how traders can incorporate them into a trading strategy.
What Are Double Candlestick Patterns?
Double candlestick patterns consist of two consecutive candlesticks that collectively indicate a potential reversal or continuation in the price trend of a financial asset. These patterns are especially useful because they balance the rapid signal provided by single candlestick patterns with the confirmation reliability often associated with multi-candlestick formations. By studying the interaction between these two candles, traders can gain insights into market sentiment and determine entry or exit points for trades.
Why Double Candlestick Patterns Matter
Double candlestick patterns are widely used in technical analysis for several reasons:
- Simplicity and Clarity: Compared to patterns with more candlesticks, double candlestick patterns are relatively straightforward, offering clear and actionable signals.
- Reliability: These patterns tend to provide a balance between quick signals and accuracy, helping traders avoid false signals more effectively than single candlestick patterns.
- Indication of Market Sentiment: The patterns capture subtle shifts in buying and selling pressure, which can often foreshadow reversals or continuation trends in the market.
Key Double Candlestick Patterns
Let’s explore some of the most commonly used double candlestick patterns: the Bullish Engulfing, Bearish Engulfing, Tweezer Tops, and Tweezer Bottoms.
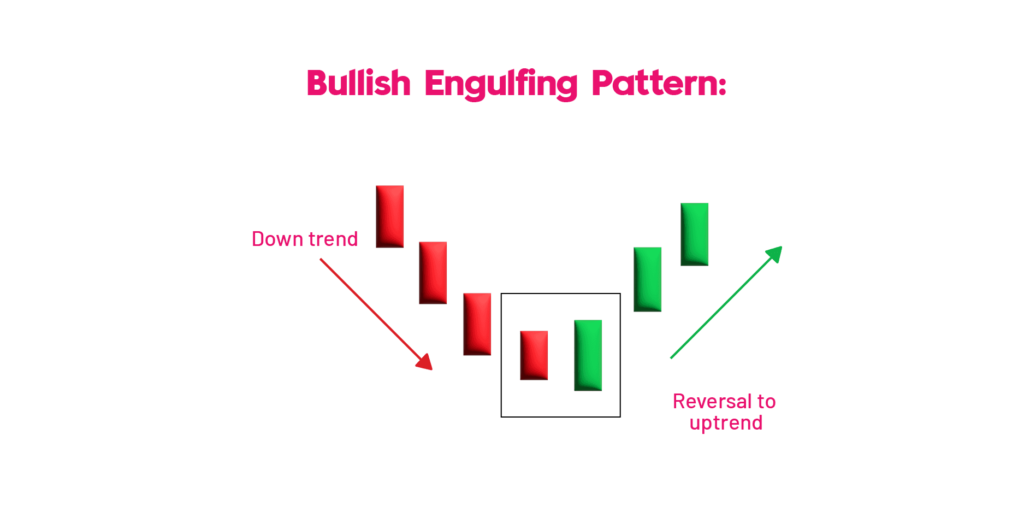
1. Bullish Engulfing Pattern
Description: A Bullish Engulfing pattern appears after a downtrend, signaling a potential reversal to the upside. This pattern consists of a small bearish (red or black) candle followed by a larger bullish (green or white) candle that completely engulfs the previous one.

Psychology Behind It: The first candlestick indicates a continuation of the bearish trend. However, the appearance of a larger bullish candlestick suggests that buyers have overpowered sellers, indicating a shift in market sentiment.
How to Trade It:
- Entry Point: Enter a long position once the second bullish candle closes.
- Stop Loss: Place a stop loss below the low of the engulfing candle.
- Take Profit: Look for key resistance levels or consider a risk-reward ratio (e.g., 1:2 or 1:3).
Example:
Suppose a stock has been experiencing a downtrend. Suddenly, you notice a small red candle followed by a larger green candle engulfing the first one. This could signal the start of an uptrend, offering a potential entry point for a long position.
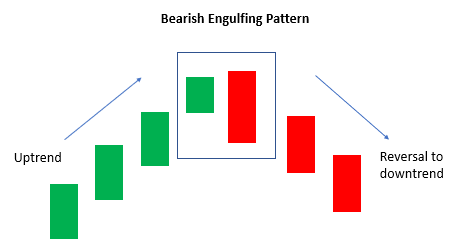
2. Bearish Engulfing Pattern
Description: A Bearish Engulfing pattern is the opposite of the Bullish Engulfing pattern. It occurs during an uptrend and consists of a small bullish candle followed by a larger bearish candle that engulfs the previous one, suggesting a reversal to the downside.

Psychology Behind It: The first candle signals that the bullish trend is still in play. The second, larger bearish candle indicates that sellers have taken control, potentially ending the uptrend.
How to Trade It:
- Entry Point: Enter a short position once the bearish candle closes.
- Stop Loss: Place a stop loss above the high of the engulfing candle.
- Take Profit: Target key support levels or a risk-reward ratio.
Example:
Imagine a cryptocurrency has been on a steady upward trajectory. You spot a small green candle followed by a larger red candle that completely engulfs it. This pattern could indicate a trend reversal, making it a good time to consider shorting the asset.
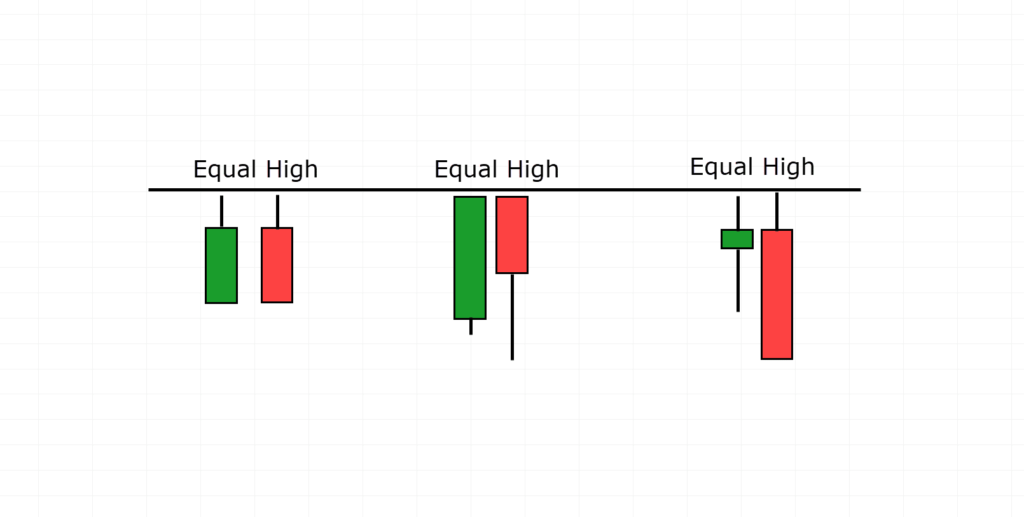
3. Tweezer Tops
Description: The Tweezer Tops pattern occurs during an uptrend and consists of two consecutive candles with almost identical highs. The first is bullish, and the second is bearish, indicating that buying pressure may be fading.

Psychology Behind It: The similar highs of the two candles indicate that buyers are struggling to push the price higher, and sellers are gaining strength. This pattern is often seen at the peak of an uptrend, signaling a potential reversal.
How to Trade It:
- Entry Point: Enter a short position after the second candle closes.
- Stop Loss: Place a stop loss just above the highs of the Tweezer Tops.
- Take Profit: Target key support levels or use a risk-reward ratio.
Example:
Suppose a stock has been climbing for several days, and you notice a green candle followed by a red candle with nearly the same high. This Tweezer Tops pattern might suggest the start of a bearish trend.
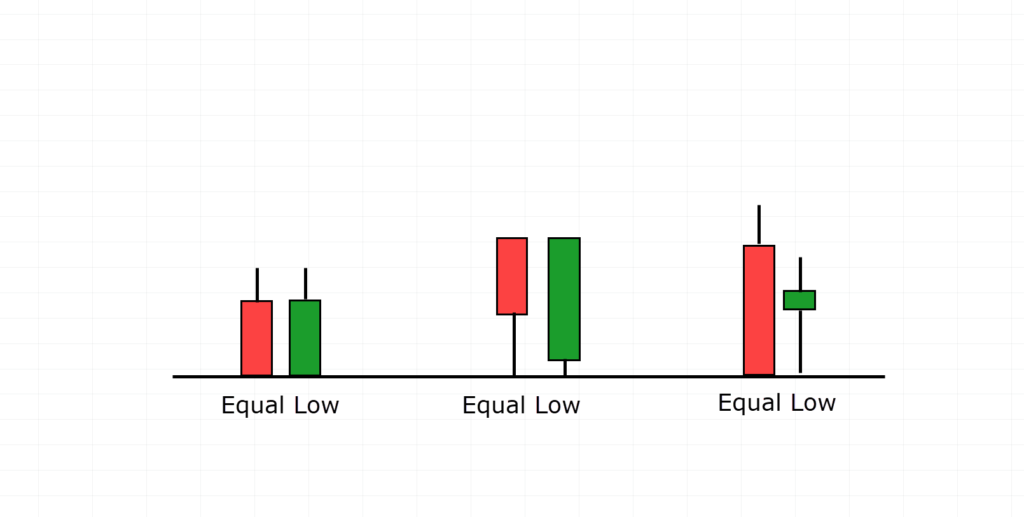
4. Tweezer Bottoms
Description: Tweezer Bottoms is the counterpart to the Tweezer Tops. This pattern appears in a downtrend, featuring two candles with similar lows. The first is bearish, and the second is bullish, indicating a potential trend reversal to the upside.

Psychology Behind It: The similar lows of the two candles indicate that selling pressure may be exhausted and that buyers could be entering the market, suggesting a possible upward reversal.
How to Trade It:
- Entry Point: Enter a long position after the second candle closes.
- Stop Loss: Place a stop loss below the low of the Tweezer Bottoms.
- Take Profit: Target key resistance levels or use a risk-reward ratio.
Example:
Imagine a currency pair has been in a prolonged downtrend. Suddenly, you notice a red candle followed by a green candle with nearly the same low. This pattern could signal a reversal, making it a favorable setup for a long trade.
How to Trade Double Candlestick Patterns Effectively
While double candlestick patterns are useful on their own, they become even more effective when combined with other technical analysis tools. Here are some tips for integrating these patterns into a well-rounded trading strategy:
- Use with Support and Resistance Levels: Confirm the validity of a double candlestick pattern by checking for nearby support or resistance levels. For instance, a Bullish Engulfing pattern forming near a key support level is more likely to indicate a reversal than if it occurs in the middle of a trend.
- Incorporate Indicators: Use technical indicators like the RSI (Relative Strength Index) or MACD (Moving Average Convergence Divergence) to strengthen your confidence in a pattern. For example, a Bullish Engulfing pattern combined with an RSI in the oversold territory can provide a stronger buy signal.
- Risk Management: Set appropriate stop losses and take-profit levels. Double candlestick patterns can be effective, but market volatility can still lead to unexpected outcomes. Ensure your trades follow a risk-reward ratio to protect your capital.
- Practice in Different Market Conditions: Test these patterns in different markets (e.g., stocks, forex, crypto) and under different conditions (e.g., bullish, bearish, sideways). This experience will help you adapt to changing market dynamics and refine your strategy.
Common Mistakes to Avoid
- Ignoring Trend Context: Double candlestick patterns are most effective when traded in alignment with the prevailing trend. Always evaluate the context of the current trend before making a decision.
- Failing to Confirm Signals: Avoid entering a trade based solely on the appearance of a double candlestick pattern. Look for confirmation from other indicators or chart patterns.
- Overtrading: Candlestick patterns, especially double patterns, can appear frequently. Overtrading on every pattern may lead to losses. Focus on high-probability setups, and don’t ignore other critical market signals.
Final Thoughts
Double candlestick patterns are a powerful tool for traders, offering insights into market sentiment with a relatively high degree of accuracy. When interpreted correctly, these patterns can lead to well-timed entries and exits. By combining them with support/resistance levels, technical indicators, and sound risk management, traders can enhance their decision-making and achieve more consistent results.
As with any trading tool, practice is key. Spend time learning to identify these patterns, understand the psychology behind them, and hone your skills with a simulated trading account before venturing into real trading.
