
The Relative Strength Index (RSI) is one of the most popular and widely used technical indicators in financial markets, particularly among traders and investors looking for ways to determine potential buy and sell opportunities.
Developed by J. Welles Wilder in 1978, the RSI measures the speed and change of price movements and provides insights into whether a security is overbought or oversold. By examining historical price data, the RSI can give signals that suggest whether a trader should consider entering or exiting a position.
In this comprehensive blog post, we will delve into the workings of the RSI indicator, its calculation, and how to interpret it effectively to generate buy and sell signals. By the end of this post, you’ll gain an in-depth understanding of how to incorporate RSI into your trading strategies.
Table of Contents
What is the RSI Indicator?
The RSI is a momentum oscillator that ranges from 0 to 100. It is designed to identify whether a stock, currency, or any other asset is overbought or oversold. An overbought condition implies that the asset has experienced significant upward momentum, and a reversal or pullback might be expected. Conversely, an oversold condition suggests that the asset has experienced significant downward momentum and may be poised for a rebound.

The RSI helps traders assess the strength or weakness of an asset’s price by comparing recent gains to recent losses. It does this in a way that produces a value on a scale of 0 to 100, with higher values indicating stronger upward momentum and lower values signaling stronger downward momentum.
Key Points:
- The RSI is a momentum oscillator.
- It is bounded between 0 and 100.
- Typically, values above 70 are considered overbought, while values below 30 are considered oversold.
- RSI is used to identify potential trend reversals.
How the RSI is Calculated
The RSI is calculated using the following formula:
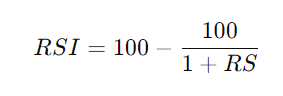
Where RS is the relative strength, calculated as:
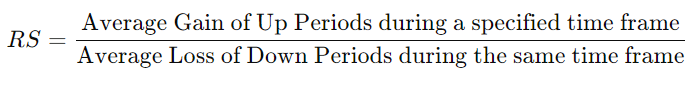
The default time frame for the RSI calculation is 14 periods (this could be 14 days, hours, or minutes depending on the timeframe used in your chart).
Here’s a step-by-step breakdown of the RSI calculation:
- Calculate the average gain over the 14-period window.
- Calculate the average loss over the 14-period window.
- Divide the average gain by the average loss to get the relative strength (RS).
- Plug the RS value into the RSI formula to get the RSI value.
The RSI formula smooths out the data and provides a momentum score for traders to work with. By default, RSI uses a 14-period setting, but this can be adjusted based on different trading styles and objectives.
Understanding the RSI Levels
The RSI levels are critical to interpreting buy and sell signals. Traditionally, RSI readings are interpreted as follows:
- Above 70: Overbought condition – This implies that the asset has risen too quickly and could be due for a correction or pullback.
- Below 30: Oversold condition – This suggests that the asset has fallen significantly, and a rebound may be in the cards.
- 50: Neutral – When the RSI hovers around 50, it indicates that the market has no clear direction and is in a period of consolidation.
However, these thresholds (70 and 30) are not set in stone. Depending on the asset or market condition, traders may adjust these levels (e.g., 80 for overbought and 20 for oversold).
Using RSI for Buy and Sell Signals
Now that we have a foundational understanding of the RSI, let’s explore how it can be used to generate buy and sell signals. The RSI provides three primary types of signals:
1. Overbought and Oversold Conditions
When the RSI moves into the overbought or oversold zones, traders are alerted to a potential reversal in the asset’s price.
- Buy Signal: When the RSI falls below 30 and then moves back above 30, it is considered a potential buy signal. This implies that the asset was oversold and may be due for a price reversal to the upside.
- Sell Signal: When the RSI rises above 70 and then drops back below 70, it is considered a potential sell signal. This indicates that the asset was overbought and may be due for a price reversal to the downside.
2. RSI Divergence: Bullish and Bearish
Divergence occurs when the price of an asset and the RSI are moving in opposite directions. This can provide a strong signal that a reversal may be imminent.
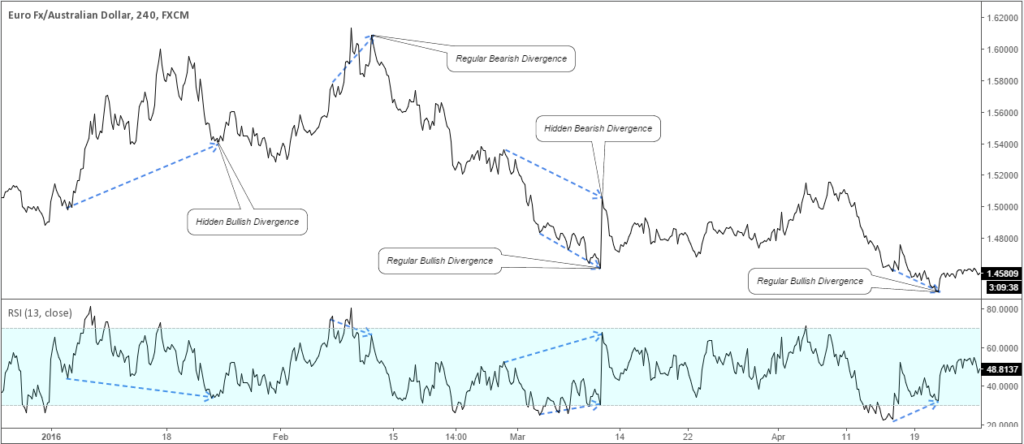
- Bullish Divergence: This occurs when the price makes a lower low, but the RSI makes a higher low. This suggests that while the price is declining, the momentum to the downside is weakening, and a bullish reversal could occur.
- Bearish Divergence: This occurs when the price makes a higher high, but the RSI makes a lower high. This suggests that while the price is rising, the upward momentum is weakening, and a bearish reversal could be in play.
3. RSI Crossovers
RSI crossovers occur when the RSI crosses certain levels (such as 30 or 70) or a midline (50), signaling potential changes in momentum.
- Buy Signal: When the RSI crosses above the 30 level from below, it may signal the beginning of a new uptrend.
- Sell Signal: When the RSI crosses below the 70 level from above, it may signal the beginning of a new downtrend.
Combining RSI with Other Indicators
While the RSI can provide valuable insights on its own, it becomes even more powerful when combined with other technical indicators such as moving averages, MACD (Moving Average Convergence Divergence), support and resistance levels, or Candlesticks.
For example:
- RSI + Moving Averages: Traders may combine the RSI with moving averages to filter out false signals. If the RSI provides a buy signal, but the price is still below a critical moving average (e.g., the 50-day moving average), the trader might wait for confirmation before entering the trade.
- RSI + Support and Resistance: Traders can also use RSI signals in conjunction with support and resistance levels. For instance, if the RSI provides a buy signal (crossing above 30), and the price is near a key support level, this confluence of signals strengthens the probability of a bullish reversal. Similarly, a sell signal near a resistance level would carry more weight.
- RSI + MACD: The Moving Average Convergence Divergence (MACD) indicator is another powerful tool that works well with the RSI. The MACD measures the difference between two moving averages, and when combined with RSI, traders can gain further confirmation of potential trend reversals. For example, if both the RSI and MACD indicate overbought conditions, a trader might be more confident in selling the asset.
Common Mistakes When Using RSI
While the RSI can be a reliable tool, many traders make mistakes when interpreting its signals. Here are some common pitfalls to avoid:
1. Relying Solely on RSI
One of the most common mistakes is using RSI in isolation without considering other factors such as trend, volume, or other indicators. While RSI can indicate overbought or oversold conditions, it’s not always a surefire signal for a reversal. Sometimes, assets can remain overbought or oversold for extended periods, especially in trending markets. To avoid this, combine RSI signals with other indicators or price action analysis for confirmation.
2. Ignoring Market Context
Market conditions play a huge role in how RSI signals should be interpreted. In a strong uptrend, for instance, the RSI may remain in overbought territory for a long time. Traders who prematurely sell based on RSI alone might miss out on further gains. Similarly, in a downtrend, the RSI can stay oversold for an extended period.
3. Not Adjusting RSI Periods
Traders often stick to the default 14-period RSI without adjusting it for the specific asset or timeframe they are trading. Short-term traders might find that a shorter period (e.g., 7 or 9) provides quicker signals, while long-term traders may prefer a longer period (e.g., 20 or 30). Adjusting the RSI period to fit the asset’s volatility and your trading strategy can provide more accurate signals.
4. Overtrading Based on Every Signal
Another mistake traders make is acting on every RSI signal. It’s important to remember that no indicator is perfect, and not every buy or sell signal will result in a profitable trade. Traders should exercise patience and wait for confluence signals (when multiple indicators or factors align) before entering a position.
Case Study: Real-World RSI Buy and Sell Signals
To better understand how RSI signals work in real-world trading, let’s examine a historical example.
Stock: Apple Inc. (AAPL)
Timeframe: Daily Chart
In late March 2020, as global markets were crashing due to the COVID-19 pandemic, Apple’s stock price plummeted along with the broader market. The RSI fell below 30, indicating that the stock was in oversold territory.
- Buy Signal: On March 23, 2020, the RSI crossed above 30, signaling a potential buying opportunity. Traders who acted on this signal would have caught the bottom of the market crash. Apple’s stock price subsequently rallied from around $224 to $375 over the next few months—a gain of more than 60%.
- Sell Signal: In early September 2020, Apple’s stock entered overbought territory with an RSI reading above 70. On September 2, 2020, the RSI crossed below 70, providing a sell signal. The stock then corrected, dropping from $134 to $107 over the next few weeks.
This example highlights how the RSI can provide timely buy and sell signals during market extremes. However, it’s important to note that traders should always confirm RSI signals with other technical analysis tools or fundamental factors.
Advanced RSI Trading Strategies
For more seasoned traders, the RSI can be incorporated into advanced strategies for greater profitability. Let’s explore a few advanced techniques:
1. RSI Swing Rejections
Swing rejections occur when the RSI approaches an overbought or oversold level but then turns around without crossing the threshold. For instance, if the RSI is approaching the 70 level but turns back down before crossing it, this may signal that the asset is not yet overbought and has room to continue its trend. The opposite applies for oversold conditions.
2. RSI Trendlines
Just like price charts, trendlines can be drawn on the RSI chart to identify support and resistance levels. If the RSI is trending upwards and consistently bouncing off a trendline, it indicates strong momentum. A break of the RSI trendline could signal a potential reversal or slowdown in momentum.
3. RSI with Fibonacci Retracements
Fibonacci retracement levels are commonly used to identify potential support and resistance levels. When combined with RSI, traders can look for buy or sell signals when the RSI is oversold or overbought near a key Fibonacci level. For example, if the RSI is oversold near a 61.8% Fibonacci retracement level, it may be an ideal point to enter a long position.
4. Multiple Timeframe Analysis
Traders can enhance the accuracy of RSI signals by using multiple timeframes. For instance, if the daily RSI is showing a buy signal, but the weekly RSI is still in oversold territory, it might indicate that a longer-term trend reversal is in play. Combining signals from different timeframes helps traders make more informed decisions.
Final Thoughts
The RSI indicator is a versatile and powerful tool in a trader’s arsenal. By identifying overbought and oversold conditions, as well as divergences and crossovers, it provides clear buy and sell signals that can help traders navigate market trends. However, like any technical indicator, the RSI is not foolproof. To improve the reliability of RSI signals, it’s essential to combine them with other technical indicators, market context, and risk management strategies.
The key to mastering the RSI lies in practice and adaptability. By understanding its strengths and limitations, and by experimenting with different periods and strategies, traders can incorporate RSI into their trading plans for more consistent and profitable results.
Remember that no indicator guarantees success, and trading always involves risk. With proper risk management and discipline, however, the RSI can be a valuable ally in your journey as a trader.
By incorporating this information into your trading strategies, you’ll gain a deeper understanding of the RSI and how to effectively use it to spot buy and sell opportunities. Whether you are a beginner or a seasoned trader, mastering the RSI can give you a significant edge in the financial markets.