Candlestick patterns are vital tools in technical analysis, providing insights into potential market movements based on historical price data. While single and double candlestick patterns are useful, triple candlestick patterns often offer more robust and reliable signals. These patterns, formed by three consecutive candlesticks, can signal strong bullish or bearish reversals or indicate continuation trends.
This comprehensive guide will explore various triple candlestick patterns, their significance, and how traders can effectively use them in their trading strategies.
Understanding Triple Candlestick Patterns
Triple candlestick patterns consist of three consecutive candlesticks that indicate potential changes in market direction. These patterns are typically more reliable than single or double candlestick patterns because they provide a clearer picture of market sentiment and potential trend reversals.
Common Triple Candlestick Patterns
1. Morning Star
Description
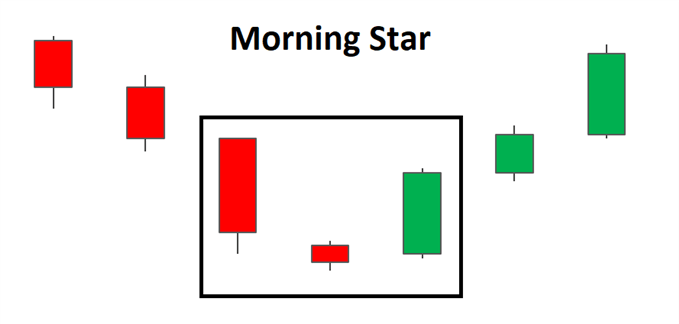
A Morning Star is a bullish reversal pattern that appears at the bottom of a downtrend. It consists of three candlesticks:
- The first candlestick is a long bearish candle, indicating strong selling pressure.
- The second candlestick has a small body (bullish or bearish) and gaps down from the first candlestick, indicating indecision or a slowdown in selling pressure.
- The third candlestick is a long bullish candle that closes well into the body of the first candlestick, indicating strong buying pressure.
Significance
- This pattern indicates a potential bullish reversal as the buying pressure represented by the third candlestick overpowers the previous selling pressure.
- It suggests that the downtrend might be ending, and a new uptrend could be starting.
2. Evening Star
Description
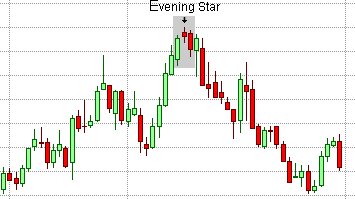
An Evening Star is a bearish reversal pattern that appears at the top of an uptrend. It consists of three candlesticks:
- The first candlestick is a long bullish candle, indicating strong buying pressure.
- The second candlestick has a small body (bullish or bearish) and gaps up from the first candlestick, indicating indecision or a slowdown in buying pressure.
- The third candlestick is a long bearish candle that closes well into the body of the first candlestick, indicating strong selling pressure.
Significance
- This pattern indicates a potential bearish reversal as the selling pressure represented by the third candlestick overpowers the previous buying pressure.
- It suggests that the uptrend might be ending, and a new downtrend could be starting.
3. Three White Soldiers

Description
The Three White Soldiers pattern is a bullish reversal pattern that appears after a downtrend or a period of consolidation. It consists of three consecutive long bullish candlesticks:
- Each candlestick opens within the body of the previous candlestick and closes near its high.
- The candlesticks do not have long upper shadows, indicating consistent buying pressure.
Significance
- This pattern indicates a strong bullish reversal as consistent buying pressure drives prices higher over three consecutive periods.
- It suggests that the downtrend might be ending, and a new uptrend could be starting.
4. Three Black Crows
Description
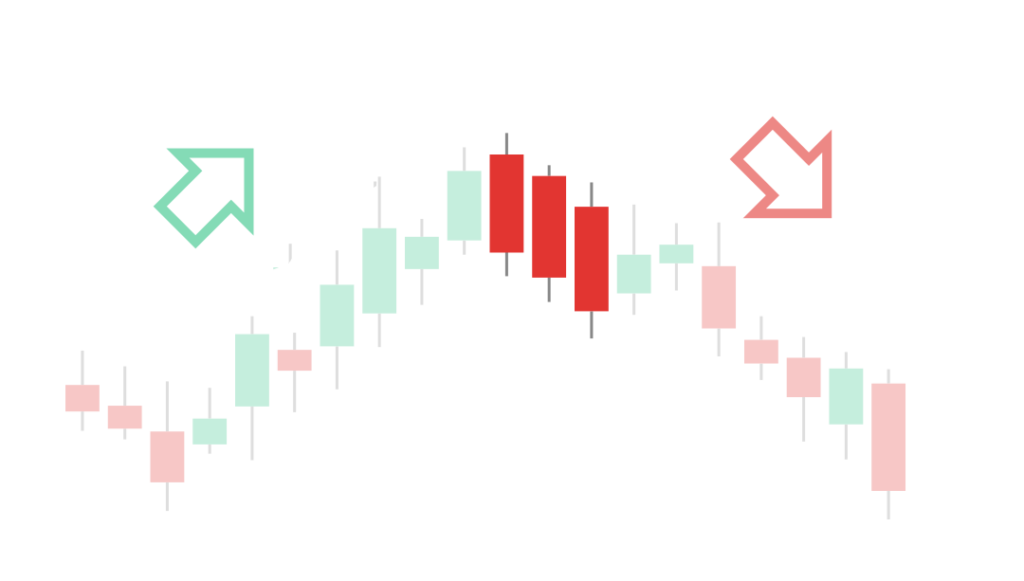
The Three Black Crows pattern is a bearish reversal pattern that appears after an uptrend or a period of consolidation. It consists of three consecutive long bearish candlesticks:
- Each candlestick opens within the body of the previous candlestick and closes near its low.
- The candlesticks do not have long lower shadows, indicating consistent selling pressure.
Significance
- This pattern indicates a strong bearish reversal as consistent selling pressure drives prices lower over three consecutive periods.
- It suggests that the uptrend might be ending, and a new downtrend could be starting.
5. Three Inside Up
Description
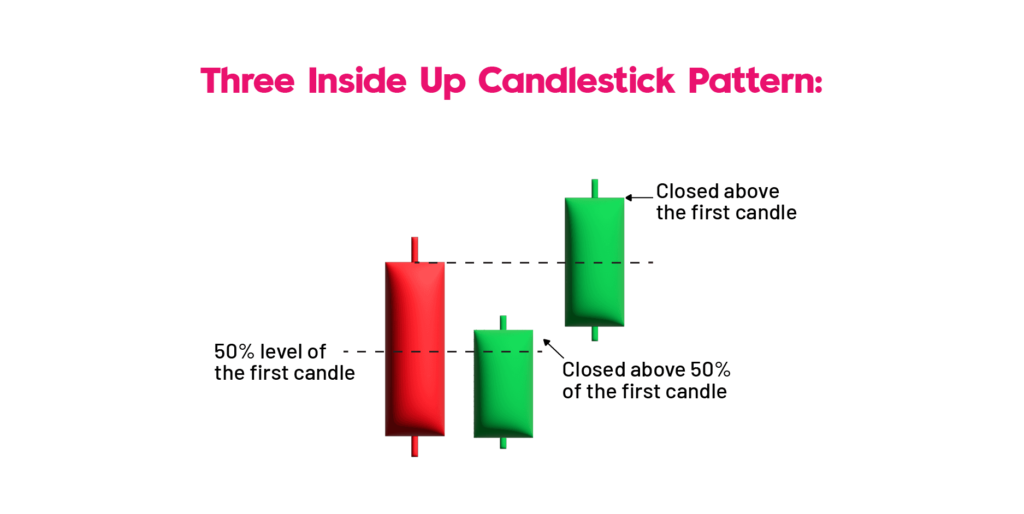
The Three Inside Up pattern is a bullish reversal pattern that appears at the bottom of a downtrend. It consists of three candlesticks:
- The first candlestick is a long bearish candle, indicating strong selling pressure.
- The second candlestick is a small bullish candle that is contained within the body of the first candlestick, indicating a slowdown in selling pressure.
- The third candlestick is a long bullish candle that closes above the high of the first candlestick, indicating strong buying pressure.
Significance
- This pattern indicates a potential bullish reversal as the buying pressure represented by the third candlestick overpowers the previous selling pressure.
- It suggests that the downtrend might be ending, and a new uptrend could be starting.
6. Three Inside Down
Description
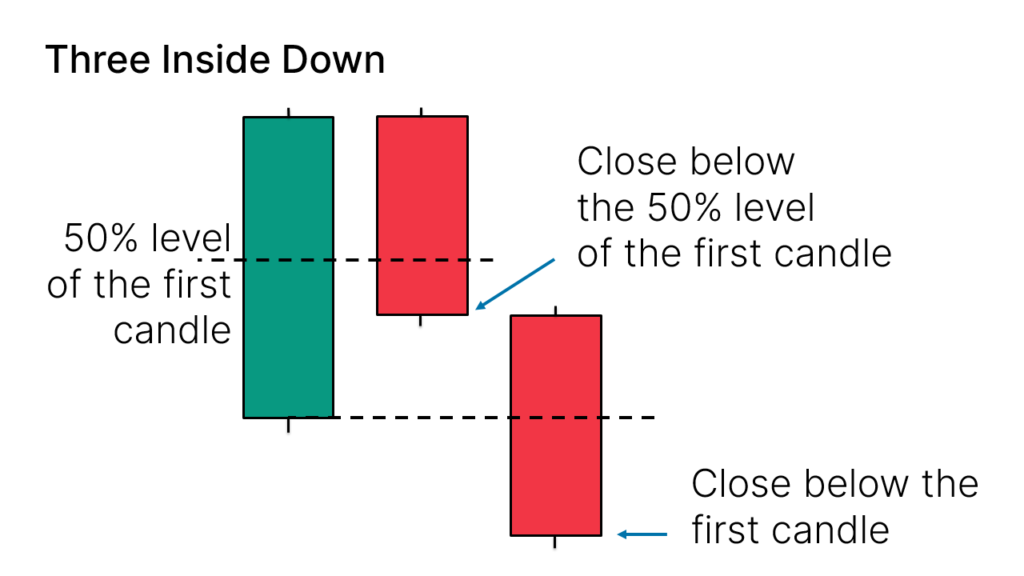
The Three Inside Down pattern is a bearish reversal pattern that appears at the top of an uptrend. It consists of three candlesticks:
- The first candlestick is a long bullish candle, indicating strong buying pressure.
- The second candlestick is a small bearish candle that is contained within the body of the first candlestick, indicating a slowdown in buying pressure.
- The third candlestick is a long bearish candle that closes below the low of the first candlestick, indicating strong selling pressure.
Significance
- This pattern indicates a potential bearish reversal as the selling pressure represented by the third candlestick overpowers the previous buying pressure.
- It suggests that the uptrend might be ending, and a new downtrend could be starting.
How to Trade Using Triple Candlestick Patterns
Confirmation
Triple candlestick patterns should be used in conjunction with other technical indicators and chart patterns for confirmation. Traders should look for additional signals from subsequent candlesticks or other tools like moving averages, RSI, and MACD to validate the potential reversal or continuation.
Context
- Trend Analysis: Determine the prevailing trend to understand the significance of the pattern. Reversal patterns in an uptrend may indicate a potential downtrend, while in a downtrend, they may indicate an uptrend.
- Support and Resistance Levels: Identify key support and resistance levels, as patterns forming near these levels can be more significant.
Risk Management
- Stop-Loss Orders: Use stop-loss orders to manage risk. For example, when trading a Morning Star pattern, place the stop-loss below the low of the pattern.
- Position Sizing: Ensure proper position sizing to manage risk and avoid significant losses.
Examples
Example 1: Trading a Morning Star Pattern
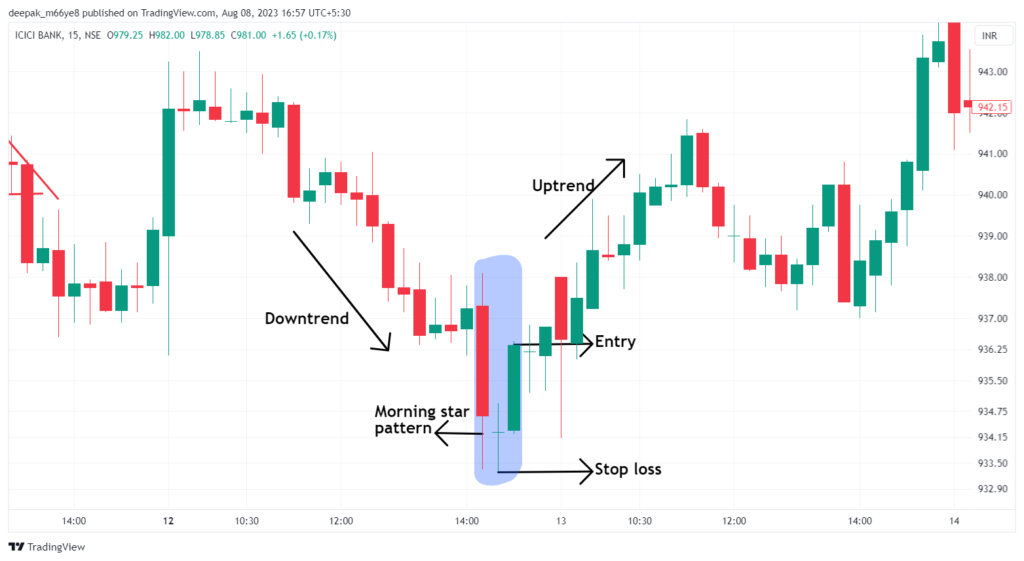
- Identify the Pattern: Look for a Morning Star pattern at the bottom of a downtrend.
- Confirmation: Wait for the next candle to close higher, confirming the bullish reversal.
- Entry: Enter a long position after the confirmation candle closes.
- Stop-Loss: Place the stop-loss below the low of the Morning Star pattern.
- Take Profit: Set a take-profit target based on the nearest resistance level or use a trailing stop to capture more gains.
Example 2: Trading an Evening Star Pattern
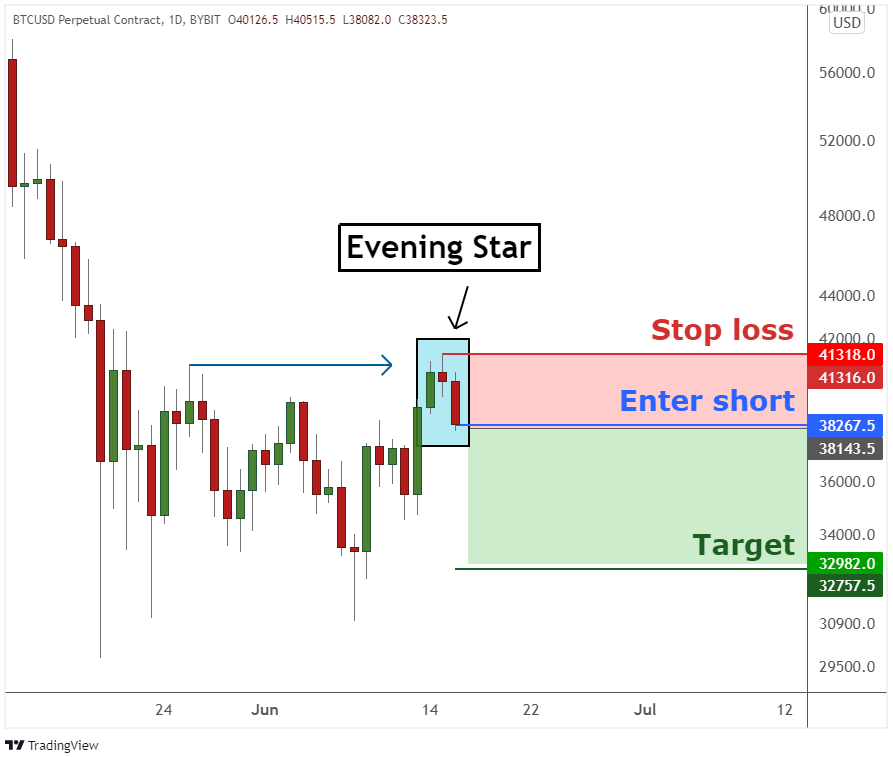
- Identify the Pattern: Look for an Evening Star pattern at the top of an uptrend.
- Confirmation: Wait for the next candle to close lower, confirming the bearish reversal.
- Entry: Enter a short position after the confirmation candle closes.
- Stop-Loss: Place the stop-loss above the high of the Evening Star pattern.
- Take Profit: Set a take-profit target based on the nearest support level or use a trailing stop to capture more gains.
Conclusion
Triple candlestick patterns are powerful tools in technical analysis, providing reliable signals for potential market reversals and continuations. By understanding and recognizing these patterns, traders can make more informed decisions and improve their trading strategies. However, it’s crucial to use these patterns in conjunction with other technical indicators and risk management practices to maximize their effectiveness and minimize potential losses. Whether you are a beginner or an experienced trader, mastering triple candlestick patterns can significantly enhance your trading performance and market understanding.
