
I wanted to let you know that this article is quite detailed and extensive. To ensure you have the best reading experience, I’ve made it available as an eBook. Simply provide your email in the form below, and I’ll send you the eBook version so you can read it at your convenience.
Table of Contents
In the volatile world of cryptocurrency trading, technical analysis tools are indispensable for making informed decisions. Among these tools, candlestick patterns stand out due to their ability to provide a visual representation of market sentiment and potential price movements. To underscore their importance, let’s consider a brief anecdote and a compelling statistic.
Anecdote: The Bitcoin Bull Run of 2017
During the Bitcoin bull run of 2017, many traders who adeptly used candlestick patterns were able to capitalize on significant price movements. For instance, in late November, a bullish engulfing pattern appeared on the daily chart, indicating a potential upward reversal. Traders who recognized this pattern and acted on it saw Bitcoin’s price surge from around $8,000 to nearly $20,000 in less than a month. This single pattern provided a clear signal amidst the market frenzy, demonstrating how mastering candlestick analysis can lead to substantial gains.
Statistic: Increased Success Rates with Candlestick Patterns
A study conducted by two prominent neuro-computing researchers analyzed the success rates of trades based on various technical analysis methods. The study revealed that traders who incorporated advanced candlestick patterns into their strategies saw a 25% higher success rate compared to those who relied solely on basic indicators like moving averages or RSI. This statistic highlights the tangible benefits of understanding and utilizing candlestick patterns, making them a crucial component of a successful trading strategy.
The aim of this blog post
The primary goal of this article is to provide a comprehensive education on advanced candlestick patterns. These patterns offer deeper insights into market dynamics than basic patterns and can signal more complex market behaviors. By understanding these advanced formations, traders can:
- Identify Stronger Reversal Signals: Advanced patterns often indicate stronger and more reliable reversal signals compared to basic patterns.
- Spot Continuation Patterns: Recognizing when a trend is likely to continue can help traders stay in profitable trades longer and avoid premature exits.
- Enhance Market Timing: Improved timing in entering and exiting trades can lead to better profit margins and reduced losses.
Enhance Trading Strategies
By incorporating these advanced candlestick patterns into their trading strategies, you will be able to significantly enhance your approach to the market. This article aims to:
- Provide Practical Examples: Through detailed explanations and real-world examples, traders can see how these patterns manifest in actual trading scenarios.
- Develop Analytical Skills: Understanding the nuances of advanced patterns helps traders develop sharper analytical skills, allowing for more accurate market predictions.
- Integrate with Other Tools: The article will show how to combine candlestick patterns with other technical indicators for a more holistic trading strategy.
Improve Trading Performance
Ultimately, the goal is to improve your trading performance. By mastering advanced candlestick patterns, we hope that you’ll be able to:
- Increase Success Rates: As shown by studies, traders who use advanced patterns tend to have higher success rates.
- Reduce Risk: Better entry and exit points help in managing and minimizing risk.
- Maximize Profits: Recognizing strong signals leads to more profitable trades.
Understanding Candlestick Basics
A candlestick in financial trading is a graphical representation of price movements over a specified time period. Each candlestick consists of a body and wicks (also known as shadows), which together illustrate the opening, closing, high, and low prices during that period.
The body of the candlestick, also known as the real body, represents the range between the opening and closing prices. If the closing price is higher than the opening price, the candlestick body is typically colored green or white, indicating a bullish trend. Conversely, if the closing price is lower than the opening price, the body is colored red or black, signifying a bearish trend.
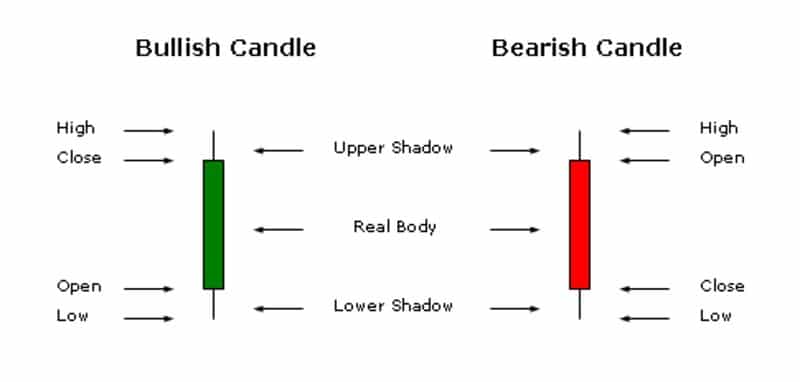
Extending from the body are thin lines called wicks or shadows, which indicate the highest and lowest prices reached during the time frame. The upper wick stretches from the top of the body to the highest price, while the lower wick extends from the bottom of the body to the lowest price. These wicks provide insights into the volatility and range of price movements within the period.
The length of the body and wicks can offer valuable information about market sentiment. A long body suggests strong buying or selling pressure, with a green body indicating strong buying interest and a red body indicating strong selling interest. Short bodies suggest consolidation or indecision among traders. Similarly, long wicks can indicate that there was significant volatility during the period, with potential rejection of higher or lower prices by the market.
By analyzing these components—the body, the wicks, and the relationship between the opening, closing, high, and low prices—traders can gain a deeper understanding of market behavior and make more informed trading decisions.
Recap of Basic Candlestick Patterns
1. Single Candlestick patterns
Single candlestick patterns are basic formations that provide insights into potential market movements based on the trading behavior captured within a single trading period. These patterns can indicate potential reversals or continuations in the market trend, and they are essential building blocks for more complex multi-candlestick patterns. Here are some of the most common single candlestick patterns:
1. Doji: A Doji occurs when the opening and closing prices are virtually the same, resulting in a very small or non-existent body. The wicks can vary in length. This pattern signifies indecision in the market, where neither buyers nor sellers have gained control. Depending on the context and location within a trend, a Doji can indicate a potential reversal.
2. Hammer: The Hammer has a small body at the upper end of the trading range with a long lower wick, indicating that sellers drove prices lower during the period, but buyers pushed the prices back up before the close. This pattern often appears at the bottom of downtrends and can signal a potential bullish reversal.
3. Hanging Man: The Hanging Man is similar in shape to the Hammer but occurs at the top of an uptrend. It has a small body at the upper end of the trading range and a long lower wick. This pattern suggests that selling pressure is increasing and could indicate a potential bearish reversal if confirmed by subsequent price action.
4. Inverted Hammer: The Inverted Hammer has a small body at the lower end of the trading range with a long upper wick. It usually appears at the bottom of a downtrend and suggests that buyers attempted to push prices higher but were met with selling pressure. This pattern can signal a potential bullish reversal, particularly if followed by a strong bullish candle.
5. Shooting Star: The Shooting Star is the bearish counterpart to the Inverted Hammer, appearing at the top of an uptrend. It has a small body at the lower end of the trading range with a long upper wick. This pattern indicates that buyers pushed prices higher, but sellers regained control and pushed prices back down, potentially signaling a bearish reversal.
These single candlestick patterns are crucial for traders as they can provide early signals of potential market reversals or continuations. However, traders often seek confirmation from subsequent candlesticks or other technical indicators before making trading decisions based on these patterns.
2. Double Candlestick Patterns
Double candlestick patterns involve two consecutive candlesticks and provide insights into potential market reversals or continuations. These patterns offer more information than single candlestick patterns because they reflect two periods of market activity, helping traders make more informed decisions. Here are some of the most common double candlestick patterns:
1. Bullish Engulfing Pattern: This pattern occurs in a downtrend and is characterized by a small bearish candlestick followed by a larger bullish candlestick that completely engulfs the body of the previous candle. The Bullish Engulfing Pattern suggests a potential reversal, indicating that buyers have taken control from sellers and the price might start rising.
2. Bearish Engulfing Pattern: The Bearish Engulfing Pattern appears in an uptrend and consists of a small bullish candlestick followed by a larger bearish candlestick that engulfs the body of the previous candle. This pattern indicates a potential bearish reversal, suggesting that sellers have overtaken buyers and the price might start falling.
3. Tweezer Tops: Tweezer Tops form at the end of an uptrend and consist of two candlesticks with similar high prices. The first candlestick is typically bullish, followed by a bearish candlestick. This pattern indicates that the upward momentum is weakening and a bearish reversal could occur.
4. Tweezer Bottoms: Tweezer Bottoms appear at the end of a downtrend and are formed by two candlesticks with similar low prices. The first candlestick is bearish, followed by a bullish candlestick. This pattern signals that the downward momentum is weakening and a bullish reversal might be on the horizon.
5. Harami Pattern: The Harami Pattern can be bullish or bearish and involves a large candlestick followed by a smaller candlestick that is contained within the body of the first candle. In a Bullish Harami, a large bearish candlestick is followed by a smaller bullish candlestick, indicating potential reversal from a downtrend. In a Bearish Harami, a large bullish candlestick is followed by a smaller bearish candlestick, signaling a potential reversal from an uptrend.
6. Piercing Line: The Piercing Line appears in a downtrend and consists of a long bearish candlestick followed by a bullish candlestick that opens below the previous low but closes above the midpoint of the bearish candlestick. This pattern indicates a potential bullish reversal.
7. Dark Cloud Cover: The Dark Cloud Cover pattern occurs in an uptrend and is characterized by a long bullish candlestick followed by a bearish candlestick that opens above the previous high but closes below the midpoint of the bullish candlestick. This pattern suggests a potential bearish reversal.
Double candlestick patterns are valuable tools for traders as they provide clearer signals of potential trend changes compared to single candlestick patterns. As with any technical analysis tool, it’s important to confirm these patterns with additional indicators or price action before making trading decisions.
3. Triple Candlestick Patterns
As the name indicates, triple candlestick patterns involve three consecutive candlesticks and are highly regarded for their reliability in signaling potential market reversals or continuations. These patterns provide a more comprehensive view of market sentiment over three periods, offering stronger indications of future price movements. Here are some of the most common triple candlestick patterns:
1. Morning Star:
The Morning Star is a bullish reversal pattern that typically forms at the bottom of a downtrend. It consists of three candlesticks:
- A long bearish candlestick.
- A small-bodied candlestick (which can be bullish or bearish) that gaps down, indicating indecision.
- A long bullish candlestick that closes well into the body of the first bearish candlestick.
This pattern suggests that the selling pressure is subsiding and buying interest is starting to dominate, signaling a potential upward reversal.
2. Evening Star:
The Evening Star is a bearish reversal pattern found at the top of an uptrend. It consists of three candlesticks:
- A long bullish candlestick.
- A small-bodied candlestick (which can be bullish or bearish) that gaps up, indicating indecision.
- A long bearish candlestick that closes well into the body of the first bullish candlestick.
This pattern indicates that the buying pressure is weakening and selling interest is beginning to take over, signaling a potential downward reversal.
3. Three Inside Up:
The Three Inside Up pattern is a bullish reversal pattern found at the bottom of a downtrend. It consists of:
- A long bearish candlestick.
- A smaller bullish candlestick that is contained within the body of the first candle.
- Another bullish candlestick that closes above the high of the first bearish candle.
This pattern indicates that the downtrend is losing momentum and a bullish reversal is likely.
4. Three Inside Down:
The Three Inside Down pattern is a bearish reversal pattern found at the top of an uptrend. It consists of:
- A long bullish candlestick.
- A smaller bearish candlestick that is contained within the body of the first candle.
- Another bearish candlestick that closes below the low of the first bullish candle.
This pattern suggests that the uptrend is losing momentum and a bearish reversal is likely.
These triple candlestick patterns are highly useful for traders because they provide clearer and more reliable signals of potential trend changes compared to single or double candlestick patterns. When used in conjunction with other technical analysis tools and indicators, these patterns can significantly enhance a trader’s ability to make informed trading decisions.
Introducing Advanced Candlestick Patterns
In the dynamic and often volatile world of cryptocurrency trading, understanding and interpreting market signals accurately is crucial for making informed trading decisions. While basic candlestick patterns provide foundational insights into market movements, advanced candlestick patterns offer a deeper and more nuanced view of market sentiment. These patterns can signal potential reversals or continuations with greater reliability, giving traders a valuable edge.
Advanced candlestick patterns go beyond the simple one- or two-candlestick formations and often involve more complex interactions among multiple candlesticks. They provide a more detailed story about the ongoing battle between buyers and sellers, helping traders anticipate future price movements more accurately. By mastering these patterns, traders can enhance their ability to spot significant trading opportunities and manage risk more effectively.
In this section, we will explore several advanced candlestick patterns that are particularly useful for cryptocurrency traders. These patterns include the Three Line Strike, Three Black Crows and Three White Soldiers, Rising and Falling Three Methods, and the Abandoned Baby. Each of these patterns has unique characteristics and implications for market behavior, and understanding them can greatly improve your trading strategy.
Let’s dive into the intricacies of these patterns and discover how they can help you navigate the complexities of the cryptocurrency market with greater confidence and success.
Advanced Bullish Candlestick Patterns
1. Tree White Soldiers
The Three White Soldiers candlestick pattern is a bullish reversal or continuation pattern that typically occurs after a downtrend or during a period of consolidation. It consists of three consecutive long bullish candlesticks, each opening within or near the previous candle’s body and closing progressively higher.

This pattern reflects a strong and sustained buying pressure in the market, as evidenced by the consecutive bullish candlesticks with little to no wicks. The fact that each candlestick opens higher than the previous one suggests that buyers are gaining increasing control over the market, pushing prices higher with each subsequent period.
Traders often interpret the Three White Soldiers pattern as a signal of a significant shift in market sentiment from bearish to bullish. It indicates a potential reversal of the previous downtrend or a continuation of the existing uptrend.
However, it’s essential to consider other factors such as volume, market context, and confirmation from other technical indicators before making trading decisions solely based on this pattern. When recognized in conjunction with other bullish signals, the Three White Soldiers pattern can provide valuable insights into potential buying opportunities and help traders navigate the cryptocurrency markets with greater confidence.
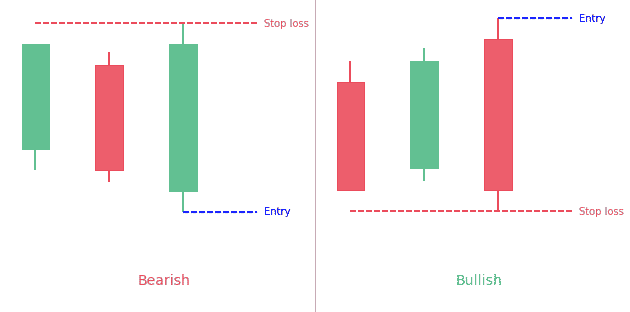
2. Bullish Abandoned Baby
The Bullish Abandoned Baby candlestick pattern is a rare and potent bullish reversal pattern that signifies a potential shift in market sentiment from bearish to bullish. It typically occurs at the bottom of a downtrend and consists of three candlesticks:
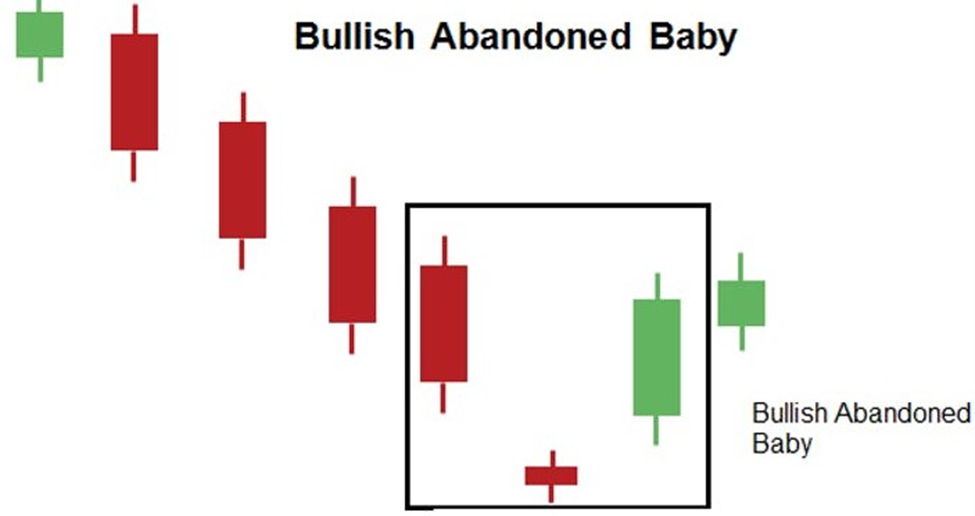
- A long bearish candlestick, representing the prevailing downtrend.
- A doji candlestick with a small body that gaps down, indicating indecision and a pause in the downward momentum.
- A long bullish candlestick that gaps up and completely engulfs the body of the previous bearish candlestick, signaling a strong bullish reversal.
The “abandoned baby” refers to the doji candlestick, which is isolated or “abandoned” from the price action of the preceding and succeeding candlesticks. This pattern suggests a sudden shift in market sentiment, with buyers overpowering sellers and driving prices sharply higher.
Traders interpret the Bullish Abandoned Baby pattern as a strong signal of a potential trend reversal from bearish to bullish. However, given its rarity, traders often seek confirmation from other technical indicators or price action before entering trades based solely on this pattern. When identified in conjunction with other bullish signals, the Bullish Abandoned Baby pattern can provide valuable insights into potential buying opportunities and help traders capitalize on market reversals.
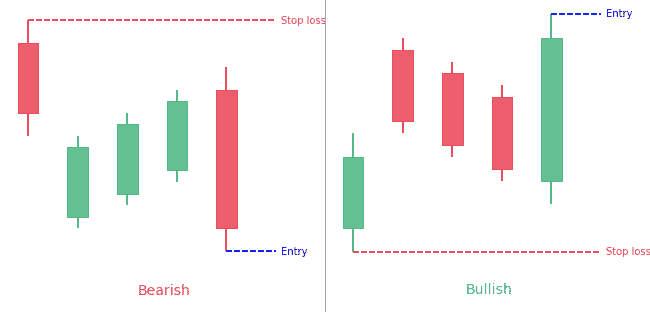
3. Rising Three Methods
The Rising Three Methods candlestick pattern is a bullish continuation pattern that typically occurs within an uptrend. It consists of five candlesticks:
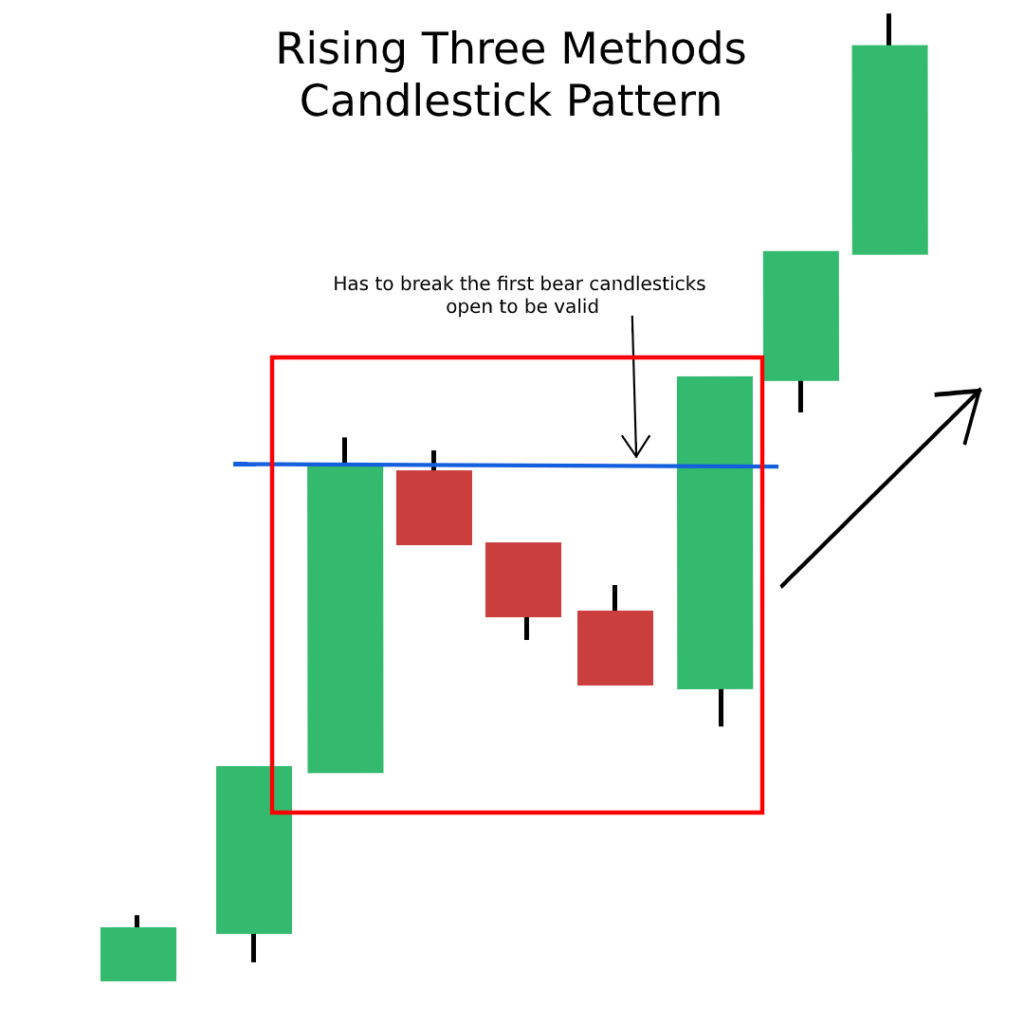
- A long bullish candlestick, representing the prevailing uptrend.
- Three small-bodied bearish candlesticks that follow the first bullish candlestick. These candles are contained within the range of the first candlestick and represent a temporary pause or consolidation in the upward movement.
- Finally, a fifth long bullish candlestick that closes higher than the close of the first candlestick, confirming the continuation of the uptrend.
This pattern suggests that despite brief periods of consolidation or retracement, the underlying bullish momentum remains strong, and buyers are likely to continue pushing prices higher. Traders interpret the Rising Three Methods pattern as a signal to enter or maintain long positions, anticipating further upward movement in the market.
As with any candlestick pattern, it’s essential to consider other factors such as volume, market context, and confirmation from other technical indicators before making trading decisions solely based on this pattern. When identified in conjunction with other bullish signals, the Rising Three Methods pattern can provide valuable insights into potential buying opportunities and help traders navigate the cryptocurrency markets with greater confidence.
Advanced Bearish Candlestick Patterns
1. Three Black Crows
The Three Black Crows candlestick pattern is a bearish reversal pattern that typically occurs at the end of an uptrend. It consists of three consecutive long bearish candlesticks, each opening within or near the previous candle’s body and closing progressively lower.
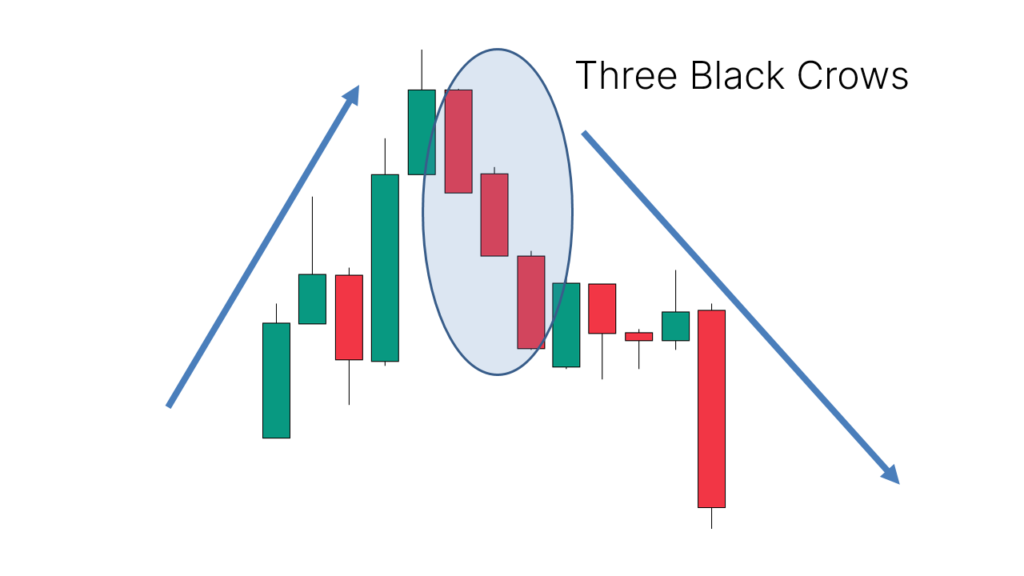
This pattern reflects a strong and sustained selling pressure in the market, as evidenced by the consecutive bearish candlesticks with little to no wicks. The fact that each candlestick opens lower than the previous one suggests that sellers are gaining increasing control over the market, pushing prices lower with each subsequent period.
Traders often interpret the Three Black Crows pattern as a signal of a significant shift in market sentiment from bullish to bearish. It indicates a potential reversal of the previous uptrend or a continuation of the existing downtrend.
However, it’s essential to consider other factors such as volume, market context, and confirmation from other technical indicators before making trading decisions solely based on this pattern. When recognized in conjunction with other bearish signals, the Three Black Crows pattern can provide valuable insights into potential selling opportunities and help traders navigate the cryptocurrency markets with greater confidence.
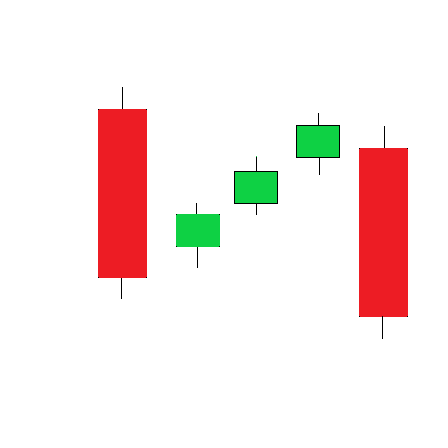
2. Bearish Abandoned Baby
The Bearish Abandoned Baby candlestick pattern is a rare and potent bearish reversal pattern that signifies a potential shift in market sentiment from bullish to bearish. It typically occurs at the top of an uptrend and consists of three candlesticks:
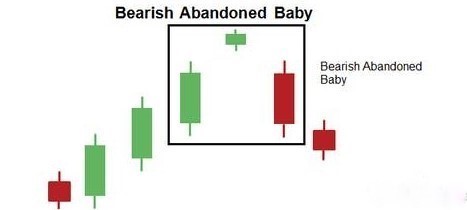
- A long bullish candlestick, representing the prevailing uptrend.
- A doji candlestick with a small body that gaps up, indicating indecision and a pause in the upward momentum.
- A long bearish candlestick that gaps down and completely engulfs the body of the previous bullish candlestick, signaling a strong bearish reversal.
Similar to its bullish counterpart, the “abandoned baby” refers to the doji candlestick, which is isolated or “abandoned” from the price action of the preceding and succeeding candlesticks. This pattern suggests a sudden shift in market sentiment, with sellers overpowering buyers and driving prices sharply lower.
Traders interpret the Bearish Abandoned Baby pattern as a strong signal of a potential trend reversal from bullish to bearish. However, given its rarity, traders often seek confirmation from other technical indicators or price action before entering trades based solely on this pattern. When identified in conjunction with other bearish signals, the Bearish Abandoned Baby pattern can provide valuable insights into potential selling opportunities and help traders capitalize on market reversals.
3. Falling Three Methods
The Falling Three Methods candlestick pattern is a bearish continuation pattern that typically occurs within a downtrend. It consists of five candlesticks:
- A long bearish candlestick, representing the prevailing downtrend.
- Three small-bodied bullish candlesticks that follow the first bearish candlestick. These candles are contained within the range of the first candlestick and represent a temporary pause or consolidation in the downward movement.
- Finally, a fifth long bearish candlestick that closes lower than the close of the first candlestick, confirming the continuation of the downtrend.
This pattern suggests that despite brief periods of consolidation or retracement, the underlying bearish momentum remains strong, and sellers are likely to continue pushing prices lower. Traders interpret the Falling Three Methods pattern as a signal to enter or maintain short positions, anticipating further downward movement in the market.
As with any candlestick pattern, it’s essential to consider other factors such as volume, market context, and confirmation from other technical indicators before making trading decisions solely based on this pattern. When identified in conjunction with other bearish signals, the Falling Three Methods pattern can provide valuable insights into potential selling opportunities and help traders navigate the cryptocurrency markets with greater confidence.
Complex Candlestick Patterns
1. Mat Hold Pattern
The Mat Hold candlestick pattern is a bullish continuation pattern that typically occurs within an uptrend. It consists of five candlesticks:
- A long bullish candlestick, representing the prevailing uptrend.
- A small-bodied bearish candlestick that follows the first bullish candlestick. This candlestick may open with a gap down but closes within the range of the first candlestick.
- Three consecutive bullish candlesticks that follow the second candlestick. These candles are usually smaller in size and may have short or no upper wicks.
The key characteristic of the Mat Hold pattern is that the third, fourth, and fifth candlesticks maintain a relatively consistent upward trajectory, with each candlestick opening above the previous close. This pattern suggests that despite minor periods of consolidation, the bullish momentum remains intact, and buyers are likely to continue pushing prices higher.
Traders interpret the Mat Hold pattern as a signal to enter or maintain long positions, anticipating further upward movement in the market. However, as with any candlestick pattern, it’s important to consider other factors such as volume, market context, and confirmation from other technical indicators before making trading decisions solely based on this pattern. When identified in conjunction with other bullish signals, the Mat Hold pattern can provide valuable insights into potential buying opportunities and help traders navigate the cryptocurrency markets with greater confidence.
2. Stick Sandwich
The Stick Sandwich candlestick pattern is a rare reversal pattern that occurs within a prevailing trend, either bullish or bearish. It consists of three candlesticks:
- The first candlestick is in the direction of the prevailing trend and has a long body.
- The second candlestick is a small-bodied candlestick that closes below the close of the first candlestick (for a bullish trend) or above the close of the first candlestick (for a bearish trend).
- The third candlestick is in the opposite direction of the prevailing trend and has a long body that engulfs the second candlestick but does not exceed the high or low of the first candlestick.
This pattern is called a “stick sandwich” because the small-bodied second candlestick is sandwiched between two larger candlesticks in the opposite direction. It indicates a temporary reversal or consolidation within the prevailing trend.
Traders interpret the Stick Sandwich pattern as a potential signal of a trend reversal, particularly if it occurs near key support or resistance levels. However, as with any candlestick pattern, it’s important to consider other factors such as volume, market context, and confirmation from other technical indicators before making trading decisions solely based on this pattern. When identified in conjunction with other reversal signals, the Stick Sandwich pattern can provide valuable insights into potential trend changes and help traders navigate the cryptocurrency markets with greater confidence.
Combining Candlestick Patterns with Other Indicators
While candlestick patterns offer valuable insights into market sentiment and potential price movements, their effectiveness can be significantly enhanced when used in conjunction with other technical indicators. Combining multiple forms of analysis helps to confirm signals, reduce false positives, and improve overall trading accuracy. Here are some key indicators that can complement candlestick patterns and provide a more comprehensive view of the market:
1. Moving Averages
Moving averages, such as the Simple Moving Average (SMA) and the Exponential Moving Average (EMA), are essential tools for identifying trends and potential reversal points. When candlestick patterns like the Three White Soldiers or the Bullish Engulfing pattern occur near moving averages, they can provide stronger confirmation of a trend continuation or reversal. For example, a Bullish Engulfing pattern appearing at the 50-day SMA can signal a more reliable bullish reversal.
2. Relative Strength Index (RSI)
The RSI is a momentum oscillator that measures the speed and change of price movements, indicating overbought or oversold conditions. By combining RSI with candlestick patterns, traders can better gauge the strength of potential reversals. For instance, if a Bullish Hammer forms while the RSI is in the oversold zone (below 30), it may signal a stronger likelihood of a bullish reversal. Conversely, if a Bearish Abandoned Baby forms while the RSI is in the overbought zone (above 70), it could indicate a more credible bearish reversal.
3. Bollinger Bands
Bollinger Bands consist of a middle band (usually a 20-day SMA) and two outer bands that are standard deviations away from the middle band. They help identify periods of high or low volatility. When candlestick patterns form near the outer bands, they can signal potential reversals or continuations. For example, a Morning Star pattern forming near the lower Bollinger Band can indicate a potential bullish reversal, while a Three Black Crows pattern near the upper band may suggest a bearish continuation.
4. Volume
Volume is a crucial indicator of market strength and the validity of price movements. High trading volume during the formation of a candlestick pattern increases the pattern’s reliability. For instance, a Rising Three Methods pattern confirmed by increasing volume can provide a stronger signal of a bullish continuation. Conversely, a Bearish Engulfing pattern accompanied by high volume can indicate a more significant bearish reversal.
5. Fibonacci Retracement Levels
Fibonacci retracement levels are used to identify potential support and resistance levels based on the key Fibonacci ratios (23.6%, 38.2%, 50%, 61.8%, and 78.6%). When candlestick patterns form near these levels, they can offer stronger signals of potential price reversals or continuations. For example, a Bullish Harami forming near the 61.8% retracement level can suggest a more reliable bullish reversal.
6. MACD (Moving Average Convergence Divergence)
The MACD is a trend-following momentum indicator that shows the relationship between two moving averages of a security’s price. Combining MACD signals with candlestick patterns can enhance trading decisions. For instance, a Bullish Abandoned Baby pattern followed by a MACD bullish crossover can provide a stronger confirmation of an upward reversal.
By integrating these technical indicators with candlestick patterns, traders can develop a more robust trading strategy. This multi-faceted approach helps validate trading signals, manage risks better, and make more informed decisions in the highly volatile cryptocurrency market. Whether you are a novice or an experienced trader, combining candlestick patterns with other indicators can significantly enhance your ability to navigate market complexities and improve your trading success.
Practical Tips for Using Candlestick Patterns
Candlestick patterns are powerful tools for traders, offering insights into market sentiment and potential price movements. However, to effectively incorporate these patterns into your trading strategy, it’s essential to follow some practical tips. Here are key considerations to help you make the most of candlestick patterns in your trading:
1. Confirm Patterns with Other Indicators:
While candlestick patterns provide valuable signals, they are most effective when confirmed by other technical indicators. Use moving averages, RSI, MACD, Bollinger Bands, and volume analysis to validate the signals generated by candlestick patterns. For example, if you spot a Bullish Engulfing pattern, confirm it with an RSI indicating oversold conditions or an MACD bullish crossover to increase the reliability of the signal.
2. Consider the Context:
Always analyze candlestick patterns within the broader context of the market. Look at the overall trend, support and resistance levels, and the current phase of the market cycle. Patterns that form at significant support or resistance levels are more likely to result in meaningful price movements. For instance, a Hammer pattern at a strong support level carries more weight than one in the middle of a range.
3. Use Multiple Time Frames:
Examine candlestick patterns across multiple time frames to get a comprehensive view of the market. A pattern that appears on a higher time frame (such as daily or weekly charts) is generally more significant than one on a lower time frame (such as 5-minute or 15-minute charts). If a Bullish Harami appears on the daily chart and is supported by bullish signals on the hourly chart, it strengthens the case for a potential upward move.
4. Be Patient and Wait for Confirmation:
Don’t rush into trades based solely on the appearance of a candlestick pattern. Wait for confirmation from subsequent price action. For instance, if you spot a Morning Star pattern, wait for the next candlestick to close higher as additional confirmation of the bullish reversal. This approach helps avoid false signals and reduces the risk of premature entries.
5. Manage Risk with Stop-Loss Orders:
Always use stop-loss orders to manage risk effectively. Place your stop-loss orders at logical levels based on the candlestick pattern and overall market structure. For example, if you enter a long position based on a Bullish Engulfing pattern, place your stop-loss below the low of the engulfing candlestick. This ensures that your potential losses are minimized if the market moves against your position.
6. Practice and Backtest:
Before applying candlestick patterns in live trading, practice identifying and trading them using a demo account or historical data. Backtest your strategies to see how well they perform under different market conditions. This helps you gain confidence and refine your approach without risking real money.
7. Keep an Eye on Market News:
Fundamental news and events can significantly impact market movements. Be aware of major economic releases, regulatory news, and other events that could influence the cryptocurrency market. Sometimes, news can overshadow technical patterns, leading to unexpected price movements.
8. Avoid Overtrading:
Not every candlestick pattern will result in a profitable trade. Be selective and avoid overtrading based on every pattern you see. Focus on high-probability setups that align with your overall trading strategy and risk management rules.
9. Learn Continuously:
The cryptocurrency market is constantly evolving, and staying updated with the latest trading techniques and market developments is crucial. Continuously educate yourself by reading books, attending webinars, and following reputable trading educators to enhance your understanding of candlestick patterns and overall market behavior.
By following these practical tips, you can enhance your ability to effectively use candlestick patterns in your trading strategy. This disciplined approach helps improve your trading decisions, manage risks better, and ultimately increase your chances of success in the highly volatile cryptocurrency market.
Conclusion
In this blog post, we’ve delved into the intricacies of advanced candlestick patterns and their invaluable role in cryptocurrency trading. From understanding the basic anatomy of candlesticks to exploring complex patterns such as the Three White Soldiers, Bearish Abandoned Baby, and Mat Hold, we’ve covered a comprehensive range of tools to enhance your trading strategy. We’ve also discussed the importance of combining these patterns with other technical indicators to increase the reliability of trading signals and provided practical tips for effectively incorporating candlestick analysis into your trading practice.
Key Points to Remember:
- Candlestick Anatomy: Understanding the structure of candlesticks is fundamental to interpreting market sentiment.
- Single, Double, and Triple Patterns: Each pattern offers unique insights into potential market reversals or continuations.
- Advanced Patterns: Patterns like the Three White Soldiers, Bearish Abandoned Baby, and Mat Hold provide deeper signals of market sentiment.
- Combining with Indicators: Use moving averages, RSI, MACD, Bollinger Bands, and volume to confirm candlestick patterns.
- Practical Tips: Consider market context, use multiple time frames, wait for confirmation, manage risk with stop-loss orders, and continuously educate yourself.
Mastering candlestick patterns is not an overnight process; it requires patience, practice, and a commitment to continuous learning. The more you practice identifying and interpreting these patterns, the more intuitive your trading decisions will become. Utilize demo accounts to hone your skills without risking real capital and backtest your strategies to understand how they perform under various market conditions.
Encouragement to Keep Practicing:
Trading is an art and a science. While understanding candlestick patterns is essential, it’s equally important to develop a disciplined trading mindset. Keep refining your approach, stay updated with market developments, and learn from each trading experience. Remember, even seasoned traders continually adapt and learn.
Call to Action:
Now that you have a solid foundation in advanced candlestick patterns, it’s time to put this knowledge into practice. Start by reviewing historical price charts to identify these patterns and see how they play out in real market scenarios. Incorporate them into your trading plan, and don’t forget to use other indicators for confirmation. Join trading communities, participate in forums, and share your experiences and insights with fellow traders. Your journey to becoming a proficient crypto trader is ongoing, and every step you take brings you closer to achieving your trading goals.
Happy trading, and may your candlestick charts guide you to profitable opportunities!
I wanted to let you know that this article is quite detailed and extensive. To ensure you have the best reading experience, I’ve made it available as an eBook. Simply provide your email in the form below, and I’ll send you the eBook version so you can read it at your convenience.